Confidential Legal Memorandum

The Metropolitan Opera House:
A Landmark at Risk

How Live Nation's monopoly power is destroying a Philadelphia treasure we spent 20 years building — and why the fight to reclaim it matters

March 2026

01
Contents

What's Inside This Memorandum

Hover to preview, click to jump directly to any section.

Section I

Background & Track Record

6 Landmarks
20 years transforming North Broad Street

How we turned Philadelphia's most blighted corridor into a national destination — six landmark restorations from the Divine Lorraine Hotel to the Metropolitan Opera House.

Explore section
Section II

The Metropolitan Deal

200+ Shows/Yr
Live Nation's own projections to our lenders

Live Nation projected 150–200+ shows per year, $50M+ in gross sales, and 80% market share. These were the commitments made to us and to our lenders.

Explore section
Section III

Promises vs Reality

200 → 93
Promised vs actual annual shows

Stark shortfalls across programming, sponsorship revenue, and market share — independently validated by the DOJ's antitrust case against Live Nation.

Explore section
Section IV

Damages

$14.1M
Expert-quantified damages (Scherf CPA)

Expert damages of $14,178,392 with a total claim approaching $255M. The show count decline from 150 to just 93 tells the story in hard numbers.

Explore section
Section V

Financials & Path Forward

$100M+
True potential value of the venue

Current debt at ~$32M, appraised at $43M on suppressed cash flow, with $100M+ potential. Our mortgage restructuring proposal and add-back revenue create the runway to prevail.

Explore section
Section VI

Appendix & Exhibits

23 Documents
Linked exhibits including lease, expert report & DOJ complaint

Complete supporting evidence — the lease agreement, expert damage report, DOJ complaint, C-PACE documents, appraisal, and full development portfolio.

Explore section
02
Background

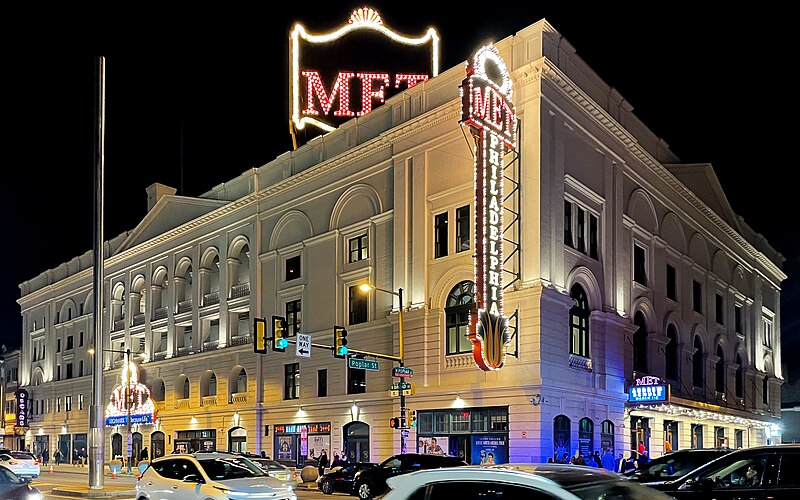
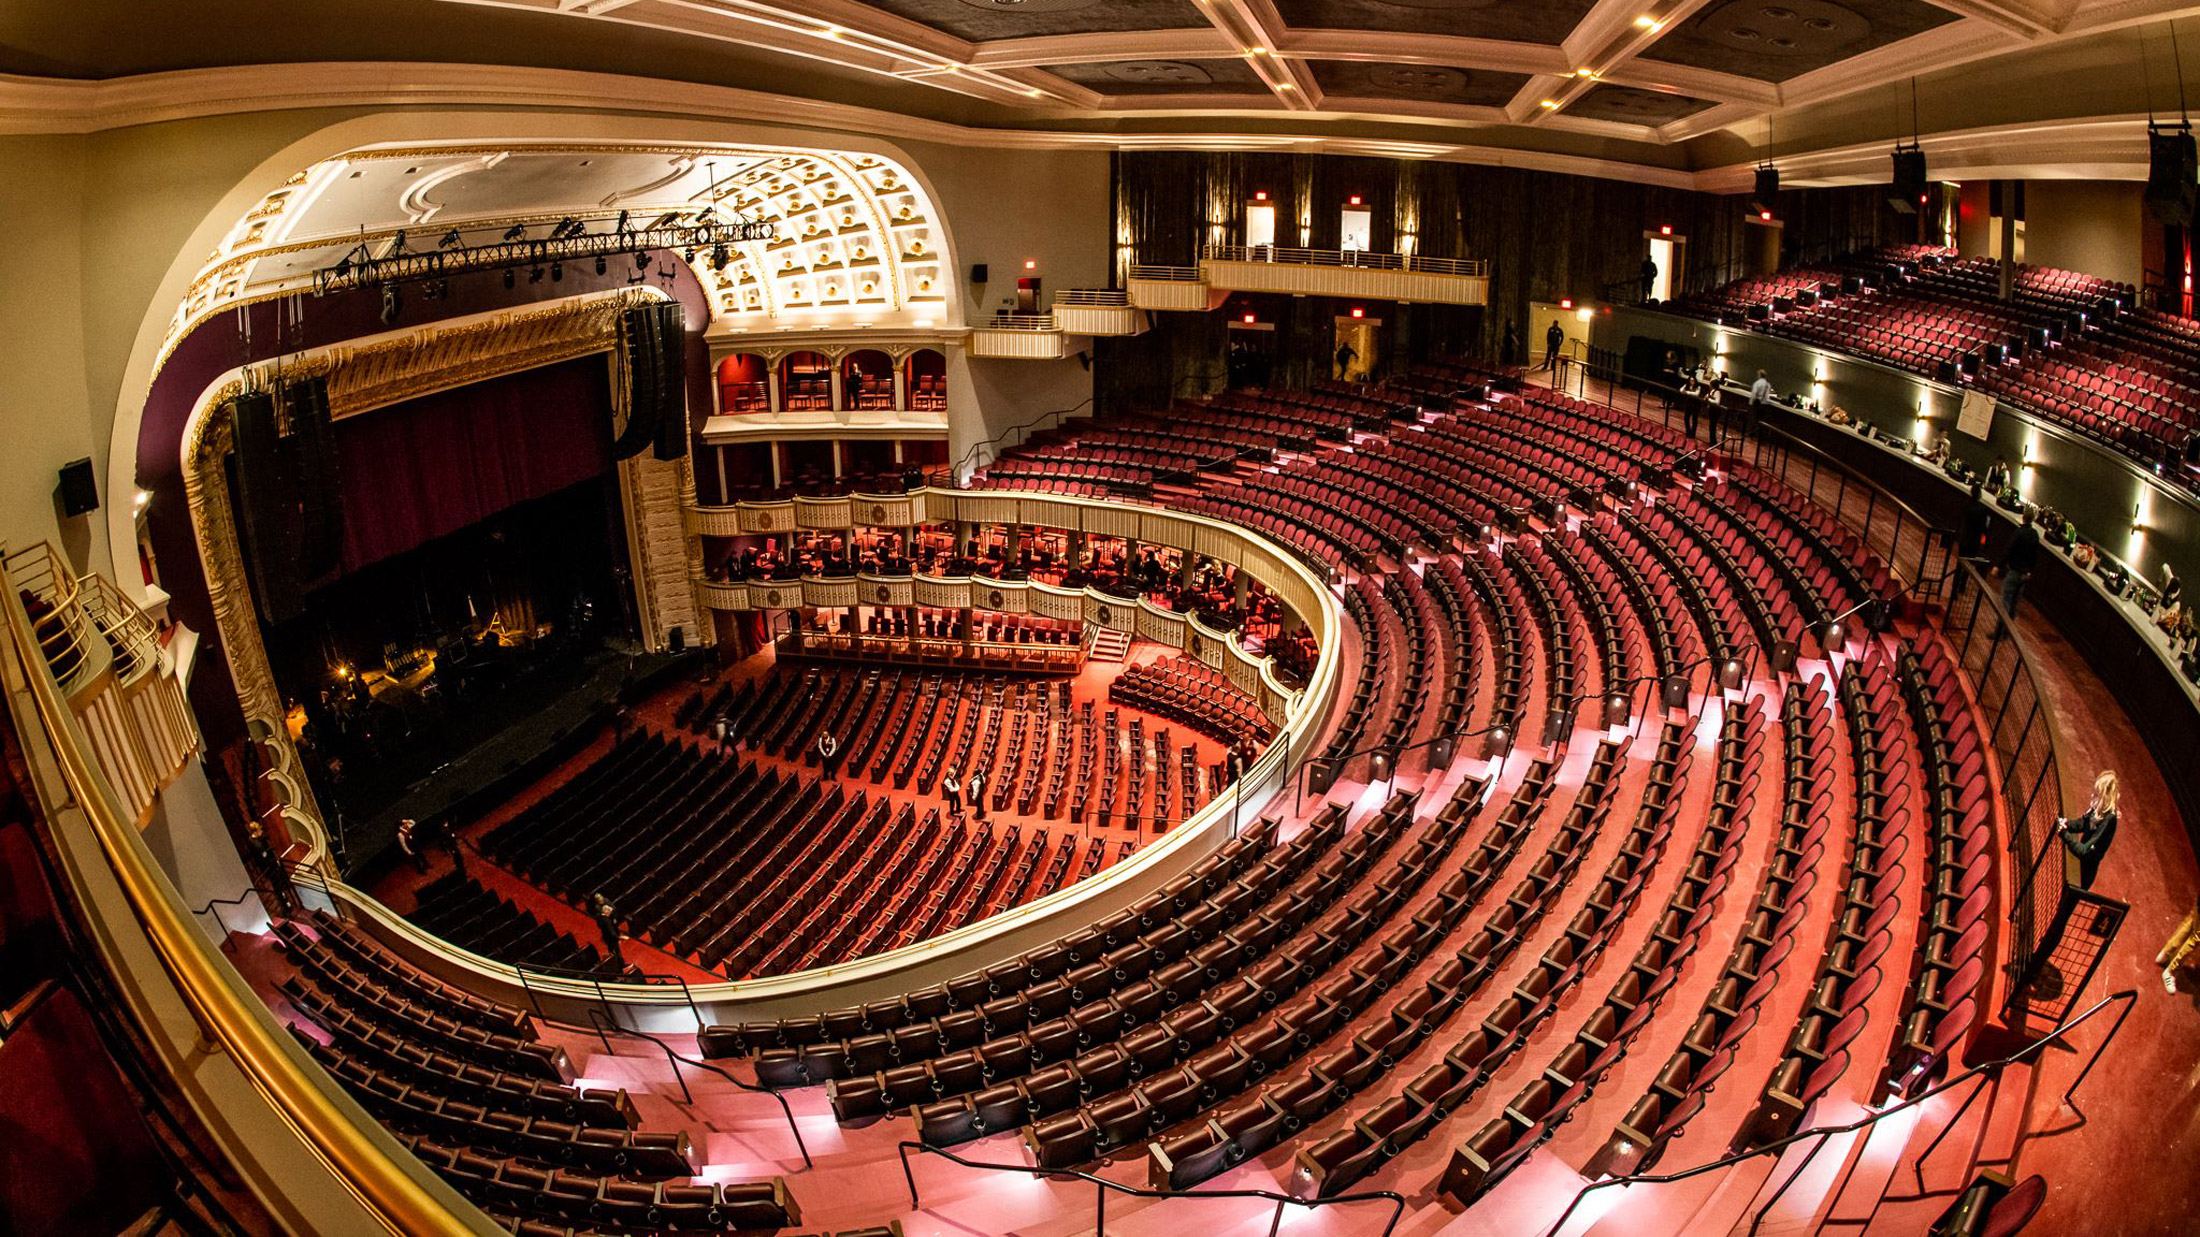
How We Transformed North Broad Street

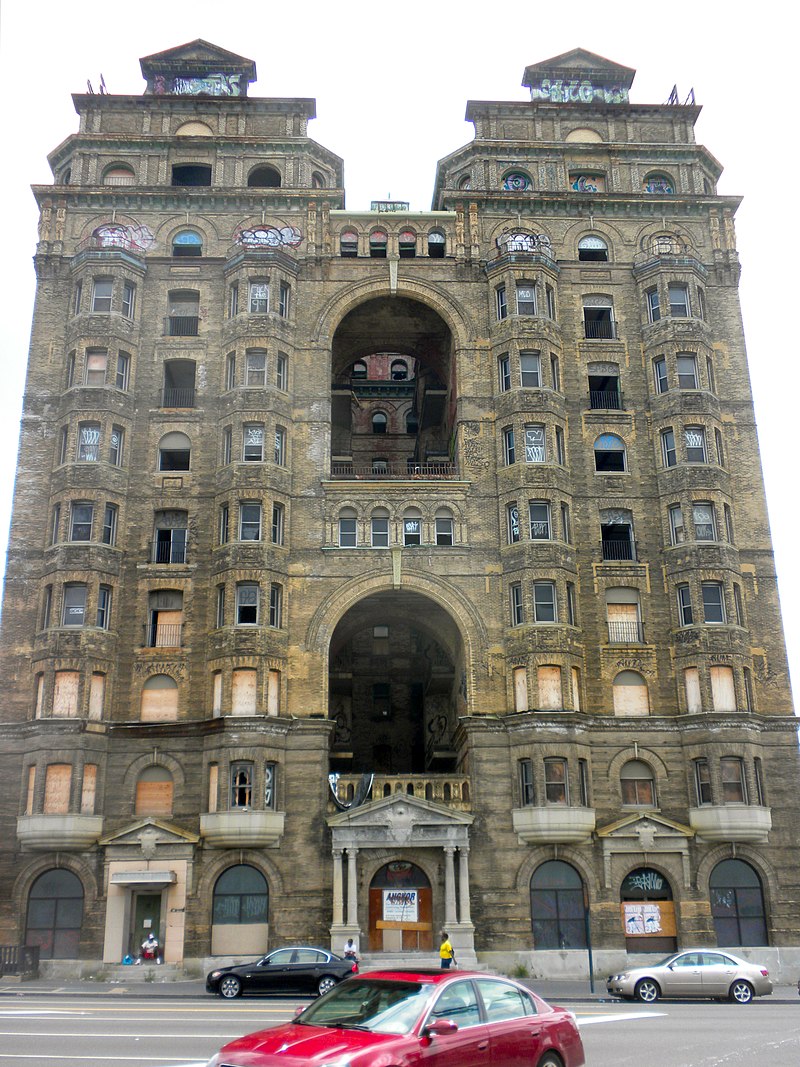
In the early 2000s, North Broad Street in Philadelphia was synonymous with crime, drugs, and urban decay. We saw what no one else could — the corridor's potential as a world-class destination.

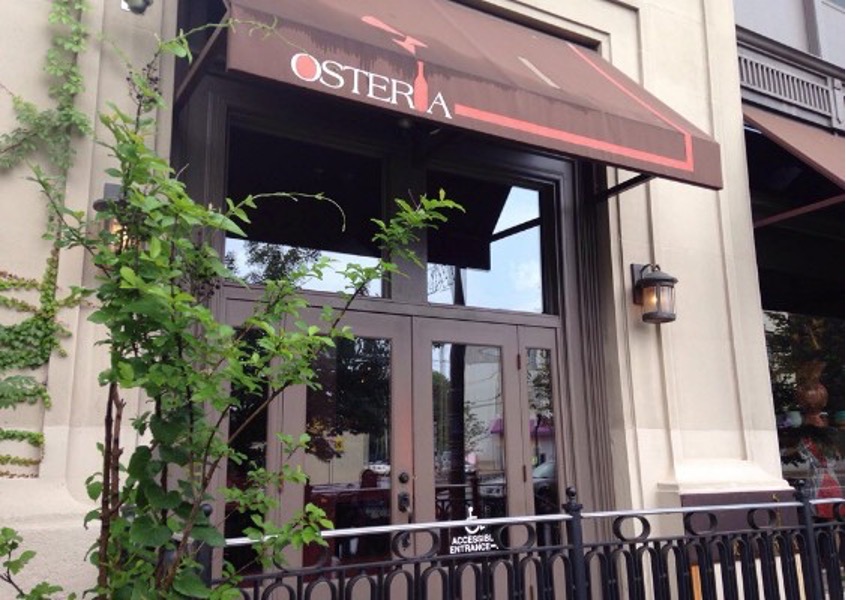
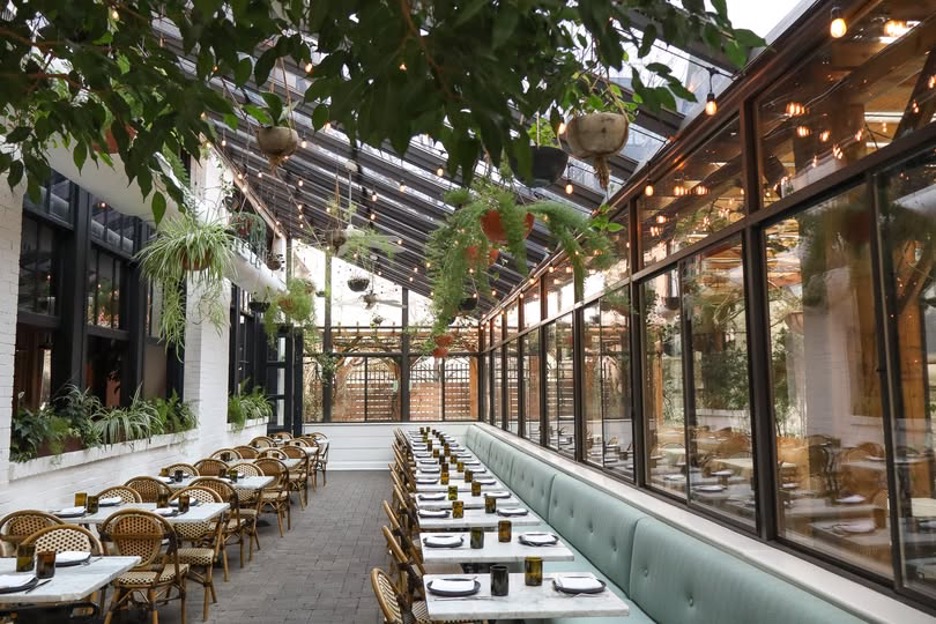
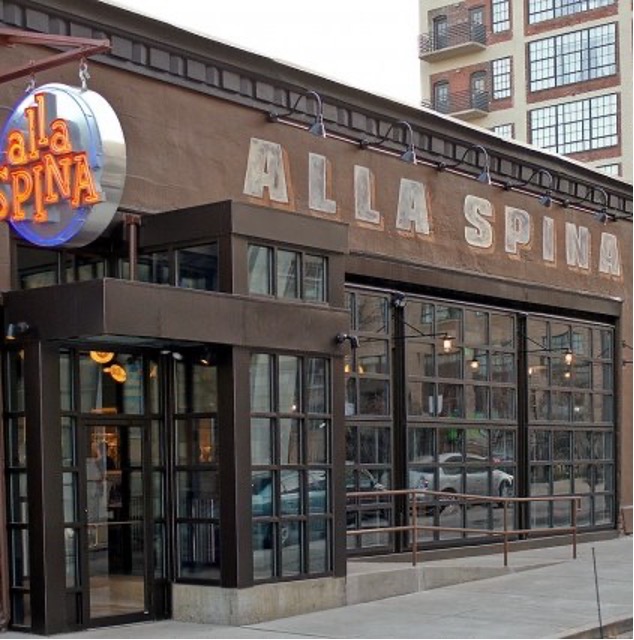
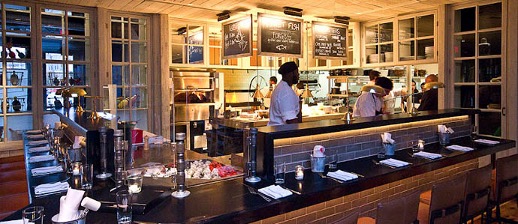
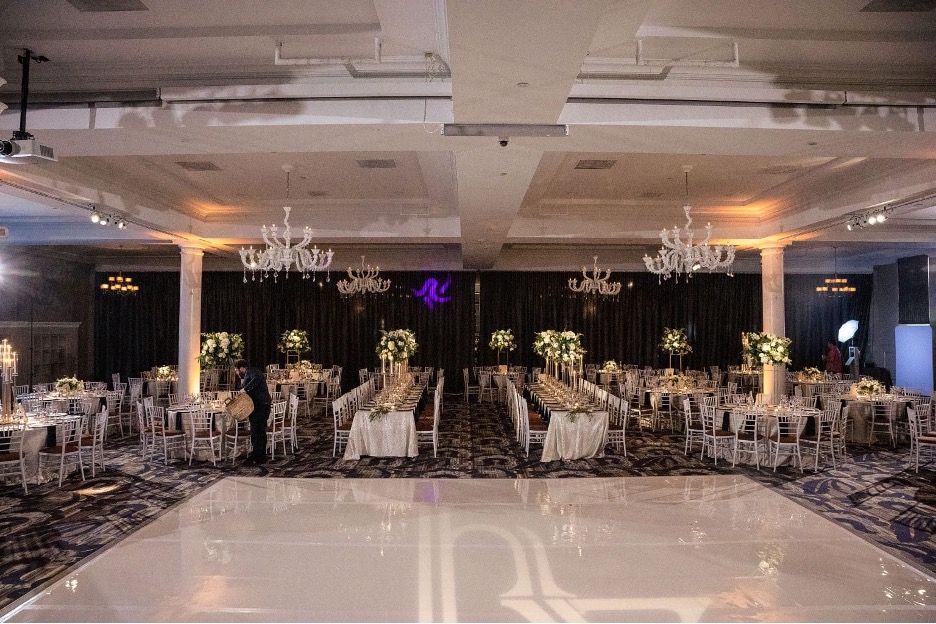
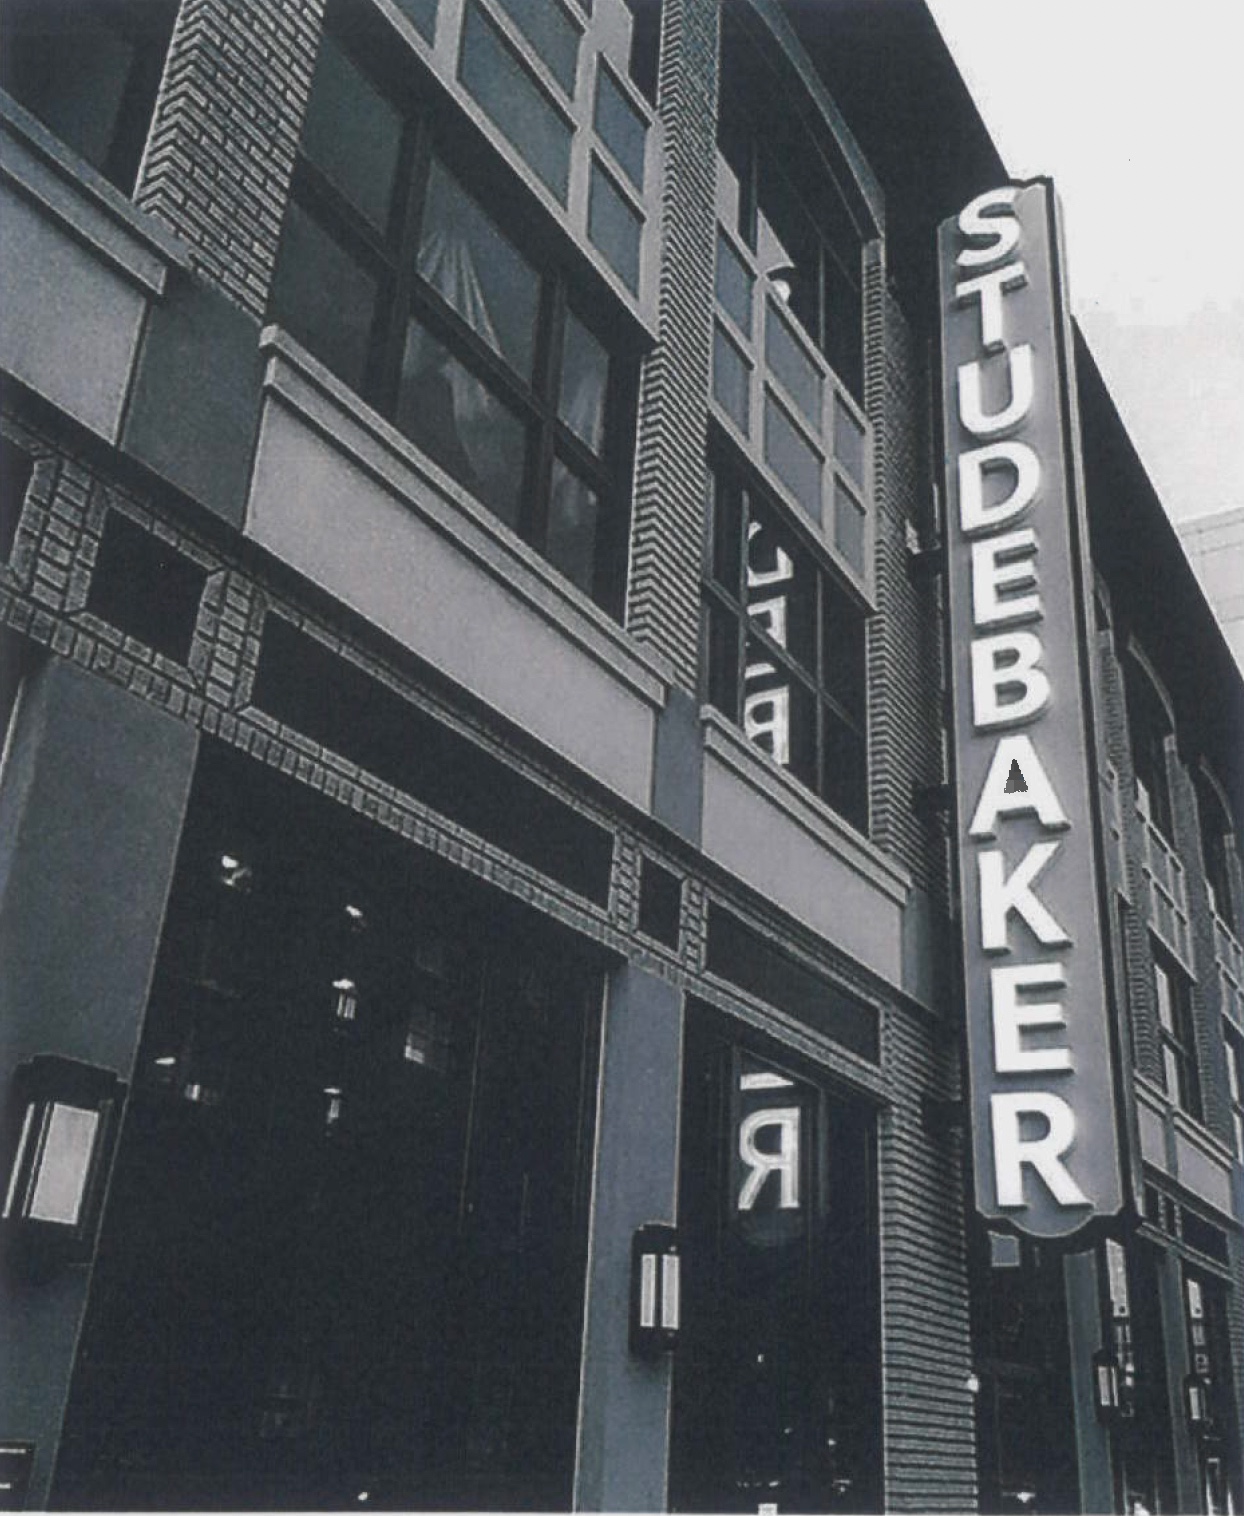
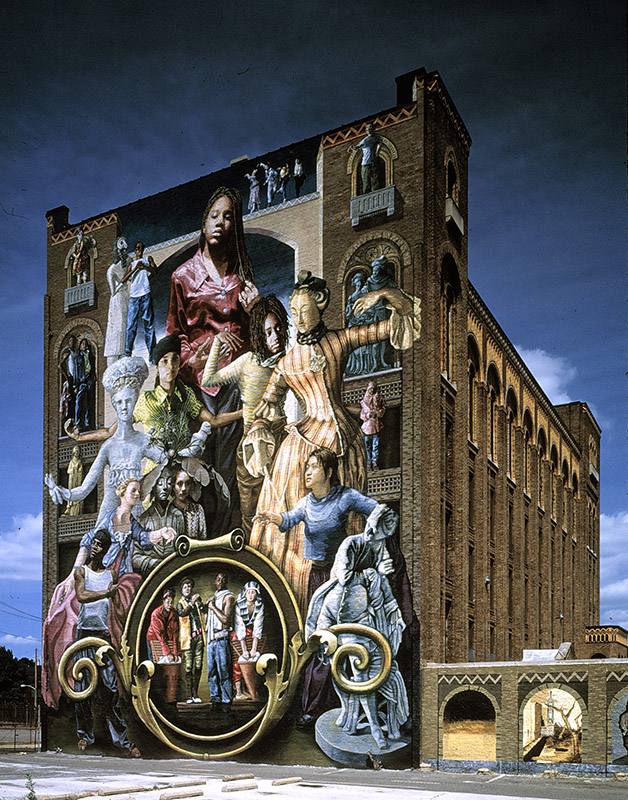
Over two decades, we systematically acquired, restored, and activated a string of historic buildings stretching from Spring Garden Street to Poplar Street, transforming one of Philadelphia's most blighted corridors into a nationally recognized hub of culture, dining, and residential life.

We believed strongly in our vision — and we backed it up with everything we had.

North Broad Street Philadelphia corridor development
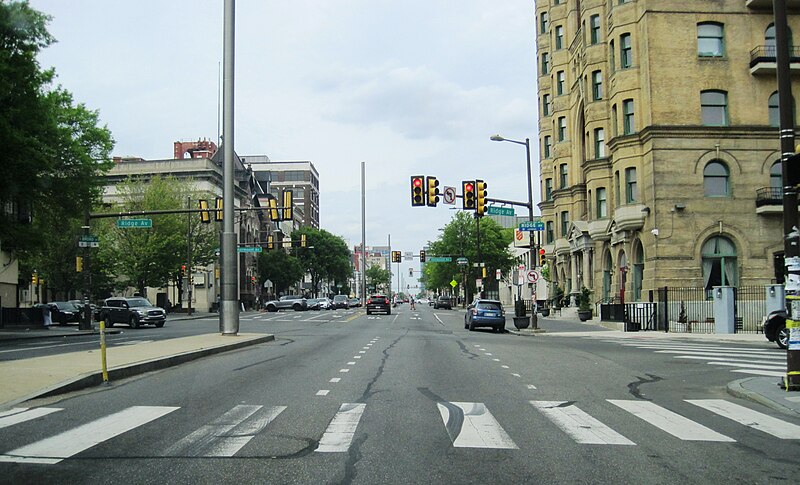
North Broad Street at Ridge Avenue, Philadelphia (2023)
03
Development Portfolio · 2005–2018

Our Track Record of Transformation

Six landmark projects where we turned Philadelphia's most neglected corridor into a destination. Click any thumbnail to explore the gallery.

2005

640 N. Broad / Osteria

265 apartment units and North Broad Street's first world-class restaurant. This was our proof of concept that premium development could succeed in the corridor.

Osteria entrance
Osteria entrance
Osteria garden dining room
Garden dining room
2008

Wilkie Buick / Bieberman Building

101 apartments anchored by Marc Vetri's Alla Spina and Stephen Starr's Route 6 — two of Philadelphia's most celebrated restaurateurs betting on our vision for North Broad.

Alla Spina exterior
Alla Spina
Route 6 interior
Route 6
Vie event space
Vie by Cescaphe
2008

Studebaker Building

We converted this into Stephen Starr Events catering hall alongside new city offices for the Philadelphia Department of Licenses & Inspection.

Studebaker Building
Studebaker Building
2014

Mural Loft Building

69 historic luxury lofts preserving Philadelphia's most famous and tallest mural — "Common Threads" by world-renowned muralist Meg Saligman.

Common Threads mural
"Common Threads" mural
2017–2018

The Divine Lorraine Hotel

Philadelphia's most iconic landmark, which we restored as a symbol of North Broad's rebirth. Home to Cicala & Sorellina Ristorantes. Its success was designed to integrate seamlessly with what came next.

Divine Lorraine Hotel
The Divine Lorraine
2018

The Metropolitan Opera House

Our crowning jewel. A venue with 3,042 fixed seats, 1,212 standing-room positions, and 358 stage-balcony seats — 4,612 total auditorium capacity — an architectural masterpiece and the project that was to bring our entire neighborhood vision together.

The Met Philadelphia exterior
The Met exterior
The Met Philadelphia interior
View from the stage
04
The Vision · 2018

The Metropolitan Opera House: Our Crowning Jewel

The Church of the Holy Ghost, who owned The Met, brought us in as their general partner to realize a transformational vision: converting The Met into a world-class entertainment venue modeled after America's greatest performance halls.

Live Nation's Own Projections for The Met

150–200+
Shows/Year Projected
(Live Nation's forecast)
450K–500K
Annual Tickets
(Live Nation's forecast)
$50M+
Gross Sales
(Casale to Fulton Bank)
80%
Market Share
(Live Nation's own claim)

Geoffrey Gordon described the Met as following the Beacon Theatre and Radio City Music Hall model — 200+ events annually.

06
The Deal

What Live Nation Promised Us

Live Nation entered the partnership with ambitious commitments designed to fully activate The Met and our surrounding properties. These were not vague aspirations — they were specific, written representations made to us and to our lenders.

"We expect the Met to have a substantial impact on our P&L numbers... Our gross sales could exceed $50 million."

— Dan Casale, Live Nation VP, letter to Fulton Bank (November 2017)

"We are highly confident the Met will exceed all expectations in terms of calendar event penetration and ticket sales."

— Dan Casale, Sept. 27, 2017

Sponsorship revenue projected "close to or in the seven figures" with prospects including SAP, Citibank, Cisco, Amazon, Pepsi.

— Andy Peikon, LN Sponsorship, Nov. 17, 2017

At The Met

  • Programming at 150–200+ shows/year — comparable to The Beacon Theatre and Radio City Music Hall (per Geoffrey Gordon)
  • Substantial sponsorship revenue across every facet
  • Restaurants on the first floor
  • A speakeasy underneath the stage
  • 15,000 sq. ft. rooftop deck with performance stage
  • 50% participation in building rentals
  • Comcast-backed food & beverage management

At The Divine Lorraine

  • Top floor renamed the "Live Nation Floor"
  • Recording studio in the basement
  • Full integration between The Met and Divine Lorraine as a unified entertainment campus

Our Compensation as Landlords

  • Entire Grande Soleil Owner's Box No. 9 (21 seats per show)
  • Estimated value: $750K–$1M+ per year
  • Sponsorship and event rights within the box
07
Promise vs. Reality · 2018–Present

What Was Promised vs. What Was Delivered

A side-by-side comparison of Live Nation's representations against actual performance:

Programming

Promised: 150–200+ shows/year, 450K–500K tickets, comparable to Beacon Theatre
Delivered: Peak of 150 shows in 2019, declining to 93 in 2025 (YTD). Show count has never approached the sustained levels projected.

Sponsorship Revenue

Promised: "Close to or in the seven figures" annually (Peikon, Nov. 2017)
Delivered: $560K/year Citi sponsorship retained by Live Nation; Landlord's 50% share systematically withheld or disputed.

C-PACE Obligations

Obligated: $5.8M C-PACE financing — Tenant's obligation under the Lease
Delivered: Paid first year ($360K), then stopped. Landlord forced to fund $1,246,000+ of Live Nation's obligation.

Food & Beverage / Ancillary Revenue

Promised: Comcast-backed F&B, restaurant, speakeasy, rooftop deck, Divine Lorraine integration
Delivered: None. The Comcast F&B opportunity was never presented. No ancillary venues were built.

08
Federal Validation · May 2024

The DOJ Confirmed What We Already Knew

On May 23, 2024, the U.S. Department of Justice and 40 state attorneys general filed a landmark antitrust lawsuit against Live Nation and Ticketmaster — the largest antitrust action in the entertainment industry in decades.

80%
of Major Venue Ticketing Controlled
400+
Artists Managed
265+
Venues Controlled
40
State AGs as Co-Plaintiffs

The trial began March 2, 2026 — validating the very claims we made years earlier. The DOJ is seeking the forced divestiture of Ticketmaster and the breakup of Live Nation's monopoly.

Our experience is a textbook example of what the DOJ describes: Live Nation's strategy of reducing programming while increasing control, at the expense of venues, artists, patrons, and property owners like us.

09
DOJ Settlement · March 2026

The DOJ Settlement: What It Means for The Met

On March 9, 2026, the DOJ filed its proposed resolution of United States et al. v. Live Nation Entertainment Inc. — an 8-year consent decree with sweeping structural remedies. Several provisions directly validate our claims and reshape The Met's future.

$280M
Settlement Fund
for affected parties
8 Years
Consent Decree Term
with court monitoring
$5M
Penalty Per Violation
of decree terms
12
Venues Ordered
Divested

Provisions Directly Impacting The Met

ProvisionRequirementImpact on Our Case
§6 — Artist Access to Venues Live Nation may not enter exclusive booking or co-promotion agreements with Major Concert Venues Directly prohibits the type of content steering that starved The Met of programming
§8 — Content Steering Live Nation may not steer content away from competing venues to benefit its own venues Validates our core claim: LN diverted programming from The Met to its own properties
§3 — Venue Divestitures 12 venues must be divested; no reacquisition permitted Establishes federal precedent that LN's venue control is anticompetitive
§2 — Contract Limits Maximum 4-year exclusive ticketing terms; TM Back-end as standalone product Breaks the lock-in that trapped venues in LN's ecosystem
§5 — Artist Access to Amphitheaters Artists must have access to LN amphitheaters regardless of promotion arrangements Confirms artists were being coerced — exactly what we allege for The Met
§13 — Settlement Fund $280,388,297 fund for affected parties EBRM may qualify as an affected party for fund distribution

The bottom line: The federal government has now confirmed — and imposed structural remedies for — the exact monopolistic practices we have alleged since 2019. The DOJ's settlement term sheet is a roadmap of validation for our claims against Live Nation.

View the full DOJ Term Sheet →

10
Litigation

Live Nation's Strategy: Death by Delay

Live Nation has reverse-engineered this litigation to ensure we do not financially survive to the trial date.

Live Nation's Playbook

  • Filed series of answers and new matters to delay proceedings
  • Defense handled by Paul Rosen, then taken over by Andrew DeFalco
  • Seven years of litigation designed to drain our resources
  • Refuses to honor C-PACE pass-through obligations during proceedings
  • Will pursue appeals even after an adverse verdict
vs.

Key Dates

  • Dec 1, 2019: We filed our lawsuit against Live Nation
  • May 23, 2024: DOJ files antitrust suit against Live Nation
  • Mar 2, 2026: DOJ antitrust trial begins
  • Jan 2027: Our trial date scheduled
  • Imminent: Judge ruling on C-PACE component
11
Quantified Damages · Expert Report (Scherf CPA, June 2025)

Damages at a Glance

$14.1M
Expert-Quantified Damages
(Scherf Report)
$57.5M
Revenue Shortfall
(Projected vs. Actual, 2019–2025)
~$255M
Total Claim
(Including Punitive & Consequential)

Expert Damages Breakdown

CategoryAmountBasis
Percentage Rent on Ticket Sales$3,312,711Projected vs. actual ticket sales shortfall (2022–Mar 2025)
Sponsorship Revenue (50% share)$1,668,090$1M+/year promised; Citi $560K/yr retained by LN
Third-Party Rental RevenueTBD45 rental events identified; 50% profit split unpaid
Real Estate Tax ObligationsTBDTenant's 97.57% share — underpayment
Landlord Usage Denial (15 days/year)TBDLease-guaranteed venue access systematically denied
Prejudgment Interest & Rent AccelerationAccruing through trial
Total Expert Damages$14,178,392

Revenue Shortfall: Live Nation projected ~$72M in total revenue for the Met from 2019 to 2025. Actual revenue received by the Landlord: ~$13.7M — a shortfall of approximately $57.5 million.

12
Performance Data · 2018–2026

Show Count: Promise vs. Performance

Live Nation projected 150–200+ shows per year. After an initial year of 150 shows (2019), programming has never returned to promised levels.

150
2019
14
2020
(COVID)
41
2021
99
2022
113
2023
126
2024
93
2025
(actual)
110
2026
(proj)

Live Nation's Projected Target: 150–200+ shows/year  |  Actual Peak: 150 (2019)  |  2025 Actual: 93

Key Insight: Even excluding the COVID year (2020), Live Nation has never sustained show counts near the 150–200+ level they projected. The 2025 actual of 93 shows — compared to 150 in the opening year — demonstrates the sustained decline in programming.

13
Financials · Profit & Loss · 2019–2030

Operating Performance: Actual & Projected

Despite Live Nation's broken promises, The Met has generated positive net income every operating year. With restructured debt and a competitive operator, performance improves dramatically.

Historical Operating Results (Actual)

20192022202320242025
Actual # of Shows1509911312693
Income
Base Rent$1,500,000$1,500,000$1,526,298$1,815,576$1,815,576
CAM$125,316$162,481$138,895$131,244$160,411
Real Estate Tax / C-PACE$31,254$368,002$0$0$0
Sponsorship Income$271,566$0$0$216,100$256,978
Ticket Percentage Rent$1,036,729$568,663$425,842$919,948$599,457
Utility Reimbursements$47,853$54,133$59,197$73,561$52,448
Total Income $3,012,717 $2,653,279 $2,150,232 $3,156,429 $2,884,870
Expense
Bank Service Charges$930$610$435$580$738
Insurance Expense$93,613$135,517$135,740$150,127$160,948
Management Fees$141,977$121,833$116,007$167,361$160,231
Professional Fees$6,000$14,000$17,600$13,400$17,002
RE Tax (C-PACE)$0$377,917$377,917$378,950$523,273
Real Estate Tax (abatement ends 12/31/29)$32,032$0$0$0$0
N. Broad Business Improvement District$0$0$0$28,289$22,598
Repairs & Maintenance$210$19,434$11,364$21,189$9,016
Roof Repairs$0$12,657$0$0$4,510
Utilities$60,063$55,825$61,194$70,135$57,252
Total Expense $334,825 $737,793 $720,257 $830,031 $955,568
Net Income $2,677,892 $1,915,486 $1,429,975 $2,326,398 $1,929,302

Undisputed Projections (2026–2030)

20262027202820292030
Projected # of Shows110118126135145
Income
Base Rent$1,815,576$1,815,576$1,827,680$1,960,824$1,960,824
CAM (Undisputed)$144,696$151,931$159,527$167,504$175,879
Real Estate Tax (abatement ends 12/31/29)
Sponsorship Income (Horizon)$256,000$256,000$256,000$256,000$271,566
Ticket Percentage Rent$756,250$828,850$901,450$1,061,775$1,159,785
Utility Reimbursements$64,000$66,250$68,750$71,250$73,750
Total Income $3,036,522 $3,118,607 $3,213,407 $3,517,353 $3,641,803
Expense
Bank Service Charges$1,000$1,000$1,000$1,000$1,000
Insurance Expense$134,972$140,371$145,986$151,825$157,898
Management Fees$141,391$145,021$149,257$163,930$169,609
Professional Fees$18,000$10,000$10,000$10,000$10,000
C-PACE (RE Tax)$487,835$483,835$479,835$477,663$159,273
Real Estate Tax (abatement ends 12/31/29)$35,438$39,438$43,438$45,610$364,000
N. Broad Business Improvement District$22,598$23,502$24,442$25,420$26,436
Repairs & Maintenance$12,000$13,000$14,000$15,000$16,000
Roof Repairs$0$15,000$0$15,000$0
Utilities$65,000$67,500$70,000$72,500$75,000
Total Expense $918,234 $938,667 $937,958 $977,948 $979,217
Net Operating Income $2,118,288 $2,179,940 $2,275,450 $2,539,405 $2,662,587
-38%
Show Count Decline
(150 → 93, 2019–2025)
-42%
Ticket Revenue Drop
($1.04M → $599K)
$2.7M
Projected NOI by 2030
(conservative baseline)
185%
Expense Growth
(2019–2025)

Key Insight: Total expenses have grown 185% since 2019 (from $335K to $956K) while total revenue declined 4% ($3.01M → $2.88M). Despite this, The Met still generated $1.93M in net income in 2025. With restructured debt, projected NOI climbs to $2.66M by 2030 as the C-PACE obligation amortizes down significantly. Note: projected expenses exclude litigation costs (~$1M through early 2027 trial).

14
Debt Structure & Restructuring

The Financial Picture

Current Debt Structure — The Metropolitan Opera House

Obligation Amount Status
Fulton Bank — 1st & 2nd Mortgages $24,221,939 Matured. Default letters received despite current payments. Balance as of 02/28/26.
HUD / PIDC Mortgage $1,838,375 Amortizing at ~$100K/year. Matures 01/23/2028.
C-PACE (Energy Improvements) ~$5,800,000 Subject of litigation. We have funded $1.246M of Live Nation's obligation. Now $523K/year.
Total Obligations ~$31,860,000

Against Real Value

$43M
Current Newmark Appraisal
(on suppressed cash flow)
$100M+
Potential Value
(with competitive operator)
$7M/yr
Market-Rate Rent
(competitor willingness to pay)

Key Financial Metrics — The Impact of Restructuring

Acquiring the Fulton Bank mortgages at a discount transforms the financial position of The Met.

MetricCurrentPost-Restructuring
Current Appraisal (Newmark) $43,000,000 $43,000,000
Total Debt ~$31,860,000 ~$16,750,000
Debt Reduction ~$15,110,000
Equity Cushion ~$11,140,000 ~$26,250,000
Annual Debt Service $2,486,071 $1,569,102 (post I/O)
Annual Cash Flow (2026) ($367,783) $207,340
Potential Value (competitive operator) $100,000,000+
Potential Annual Rent (market rate) $7,000,000/year
Owner's Box Annual Value (GBOX9 — 21 seats) $410,000+ per year (90 shows)

The bottom line: Restructuring at ~$16.75M brings total obligations from ~$31.9M down significantly — more than doubling the equity cushion to ~$26.25M against a $43M appraised value. Under the current debt structure, the property runs a negative cash flow of −$368K/year. Restructuring flips that to positive from day one. At 8% with a 25-year amortization, debt service is fully covered by NOI. With a competitive operator, this venue is worth $100M+.

15
The Proposal

The Path Forward: Salvaging Our Vision

We are seeking to acquire the Fulton Bank first and second mortgages at a discount, restructured to provide the runway we need to see the litigation through.

Proposed Mortgage Restructuring

~$16.75M
Maximum Supportable Debt
(at 1.35× DCR)
8%
Fixed Interest Rate
25 Years
Amortization
(2.5-year I/O period)

Restructured Cash Flow Profile

20262027202820292030
Net Operating Income $2,118,288 $2,179,940 $2,275,450 $2,539,405 $2,662,587
Restructured Debt Service ($1,910,948) ($1,339,985) ($1,339,985) ($1,569,102) ($1,569,102)
Cash Flow After Debt $207,340 $839,955 $935,465 $970,303 $1,093,485

Why This Works

1. Positive cash flow from day one
Even in the I/O period, the restructured debt service is covered by NOI with room to spare.

2. We survive the litigation
Our January 2027 trial date is within reach. The 2.5-year I/O period bridges to resolution.

3. Preserves $43M+ asset value
The building's appraised value far exceeds all outstanding obligations.

4. Unlocks $100M+ potential
Competitive operators are willing to pay $7M/year if Live Nation is evicted.

16
Revenue Recovery · Projected Add-Backs

Add-Back Revenue Sources

Beyond the baseline NOI, additional revenue becomes recoverable as the venue ramps under restructured operations. These add-backs represent income currently suppressed by Live Nation's underperformance and disputed lease obligations.

Projected Add-Back Detail (2026–2030)

20262027202820292030
Total Shows (7% annual growth)150160172184197
Additional Shows vs. Baseline4042464952
Additional Tickets Sold100,000105,000115,000122,500130,000
Recoverable Income
Ticket Sales Revenue$381,150$417,450$480,249$509,652
C-PACE Recovery (97%)$471,739$467,839$465,722$155,291
Sponsorship Income$250,000$257,500$265,225$273,182
CAM Recovery$154,744$157,916$171,114$175,381
Comp Ticket Value (avg 135/show)$57,826$61,746$71,442$76,734
RE Tax Recovery (97%)$38,452$42,352$44,470$354,900
N. Broad BID (97%)$22,914$23,831$24,784$25,776
Signing Bonus$1,000,000
Total Add-Back Income $2,376,825 $1,428,634 $1,523,005 $1,570,916

Cash Flow With Add-Backs & Investor Return

20262027202820292030
Restructured Cash Flow $207,340 $839,955 $935,465 $970,303 $1,093,485
Add-Back Income $2,376,825 $1,428,634 $1,523,005 $1,570,916
Total Potential Cash Flow $207,340 $3,216,780 $2,364,099 $2,493,308 $2,664,400
Investor Economics (50/50 Split)
Base Coupon (8% on ~$16.75M) $1,339,985 $1,339,985 $1,339,985 $1,339,985 $1,339,985
50% Investor Share of Add-Backs $1,188,413 $714,317 $761,503 $785,458
Total Potential Annual Return 10.5% 17.6% 14.8% 15.1% 15.2%

Conservative assumptions: Show count growth is modeled at 7% annually from the 2019 peak of 150 shows — well below Live Nation's original commitment of 200+ shows/year. Ticket pricing uses current CPI-adjusted rates. All real estate pass-throughs assume 97% recovery. Add-back income is shared 50/50 with investors, providing significant upside beyond the guaranteed 8% coupon.

17
Return Profile · Restructured Scenario

Investor Return Summary

Baseline 8% coupon with potential upside from additional revenue sources as the venue ramps under restructured operations.

8%
Base Coupon Rate
(fixed annual)
10.5–15.2%
Total Potential Return
(base + upside share)
1.35×
Debt Coverage Ratio
(underwritten)

Projected Return by Year

20262027202820292030
Baseline
Net Operating Income $2,118,288 $2,179,940 $2,275,450 $2,539,405 $2,662,587
Debt Service ($1,910,948) ($1,339,985) ($1,339,985) ($1,569,102) ($1,569,102)
Restructured Cash Flow $207,340 $839,955 $935,465 $970,303 $1,093,485
Add-Back Revenue (50% Investor Share)
Investor Share of Add-Backs $1,188,413 $714,317 $761,503 $785,458
Total Potential Cash Flow $207,340 $2,028,368 $1,649,782 $1,731,806 $1,878,943
Total Potential Annual Return 10.5% 17.6% 14.8% 15.1% 15.2%

Upside sources include: Additional ticket percentage rent from increased show counts, CAM pass-throughs, real estate tax and C-PACE recovery (97%), sponsorship income (Citi and others), comp ticket value, and N. Broad BID pass-throughs. These are projected conservatively and shared 50/50 between owner and investor. The baseline 8% coupon is fully covered by NOI in all projected years.

18
Summary

The Case for Action

The Property

  • Meticulously restored 1908 architectural masterpiece
  • Considered by music executives to be the best venue of its kind in the country
  • Appraised at $43M on suppressed cash flow
  • Upside potential exceeding $100M

The Legal Landscape

  • DOJ antitrust case validates our claims
  • DOJ settlement bans content steering & exclusive booking — the exact practices we allege
  • $280M settlement fund; $5M per violation penalty
  • Our trial set for January 2027

Our Track Record

  • 20+ years of transformational development
  • Turned Philadelphia's most blighted corridor into a national destination
  • Backed every project with our personal conviction and capital

What We Need: Mortgage restructuring at a discount to provide a 5-year runway. This preserves value for all stakeholders and positions the property for its full potential once our litigation resolves.

19
Appendix

Our Development Portfolio & Key Metrics

Properties We Developed on North Broad Street (2005–2018)

YearPropertyDevelopment
2005640 N. Broad / Osteria265 apartments, world-class restaurant
2008Wilkie Buick / Bieberman Building101 apartments, Alla Spina, Route 6
2008Studebaker BuildingStephen Starr Events, City offices (L&I)
2014Mural Loft Building69 luxury lofts, preserved "Common Threads" mural
2017–18Divine Lorraine HotelLandmark restoration, Cicala & Sorellina restaurants
2018Metropolitan Opera HouseWorld-class entertainment venue — 4,612 auditorium capacity (7,420 full building)

Key Financial Metrics — The Met

MetricCurrentPost-Restructuring
Current Appraisal (Newmark)$43,000,000$43,000,000
Total Debt~$31,860,000~$16,750,000
Debt Reduction~$15,110,000
Equity Cushion~$11,140,000~$26,250,000
Potential Value (competitive operator)$100,000,000+
Potential Annual Rent (market rate)$7,000,000/year
Owner's Box Annual Value (GBOX9 — 21 seats)$410,000+ per year (90 shows)
20
Evidence & Documentation

Exhibit Index

All supporting documents are linked below, organized by category.

Lease & Core Agreements

#DocumentDescription
1Fully Executed LeaseEvent Center Lease, April 24, 2017 — 29-year term
2Lease Commencement AgreementDecember 2018 — confirms Dec 3, 2018 start date & punchlist

Pleadings & Expert Reports

#DocumentDescription
3Verified ComplaintPlaintiffs' complaint — breach of contract, conversion, unjust enrichment, tortious interference
4Defendants' AnswerLive Nation's formal response (November 2020)
5Expert Report Draft (Scherf CPA)June 2025 — quantifies $14,178,392 in damages
6DOJ Antitrust ComplaintU.S. v. Live Nation/Ticketmaster — monopolistic practices
6ADOJ Settlement Term SheetMarch 2026 — Resolution terms including venue divestitures, booking restrictions, $280M settlement fund

Appraisal & Financial Analysis

#DocumentDescription
72025 Appraisal Report$43M property valuation (Newmark)
8Lost Revenues AnalysisProjected vs. actual revenue — ~$255M total damages claim
9Percentage Rent DataShow counts & ticket revenue by year (2018–2026)
10Legal & Professional FeesLitigation costs (Braverman Kaskey 2019–2024, Asterion 2024–2025)

Live Nation Pre-Lease Representations

#DocumentDescription
11Casale Ticket Sales AnalysisSept 2017 — Live Nation feasibility study, "exceed all expectations"
12Casale/Fulton Bank SponsorshipNov 2017 — 80% market share, $50M+ gross sales, financial projections to lender
13Peikon/Gordon Sponsorship EmailsNov 2017 — seven-figure sponsorship projection; Gordon's resistance to transparency
14PIDC Sponsorship Email ChainMar 2019 — NIT sponsorship scope dispute; PIDC confirms "all Premises"

Capacity, Eligibility & Premium Assets

#DocumentDescription
15Architect Capacity EmailNov 2018 — Ruthie Embry confirms 4,612+ auditorium capacity
16Embry CertificationJan 2026 — distinguishes capacity vs. Required Capacity (Section 27.28)
17SVOG Eligibility DocumentationCOVID relief ineligibility due to Live Nation's corporate structure
18GBOX9 Premium Box Memo21-seat premium box — $410K+ value for 90 shows

Case Summary & Analysis

#DocumentDescription
19Eric's Summary/OverviewNarrative case overview and development history
20Master Exhibit ListComplete exhibit index with categories
21Legal Risk AssessmentComprehensive risk assessment — 12 risk categories, all CRITICAL or HIGH
22Meeting BriefStructured litigation briefing with talking points and action items
21
Contact

Next Steps

All exhibits referenced above are available for download. For additional information or to schedule a meeting:

Eric Blumenfeld / EBRM

530 S. 2nd Street, Suite 110

Philadelphia, PA 19147

Confidential · March 2026

22